Experiment 1: MPD Power Generation - 24-Hour Validation

Experiment Purpose

To validate the possibility of utilizing a voltage difference in plants for energy, an experiment was conducted to show the existence of potential differences in charge and electrical current. This experiment benchmarks the performance of different electrode pairs for efficiency and durability in a real-tree bio-voltaic system.

Experimental Procedure

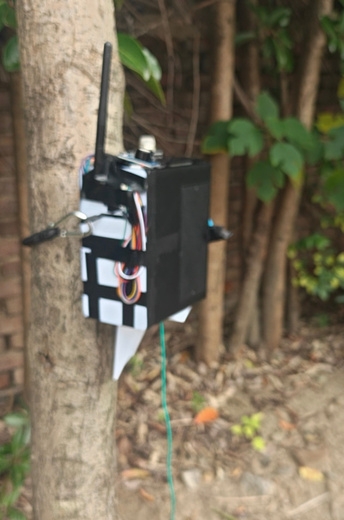
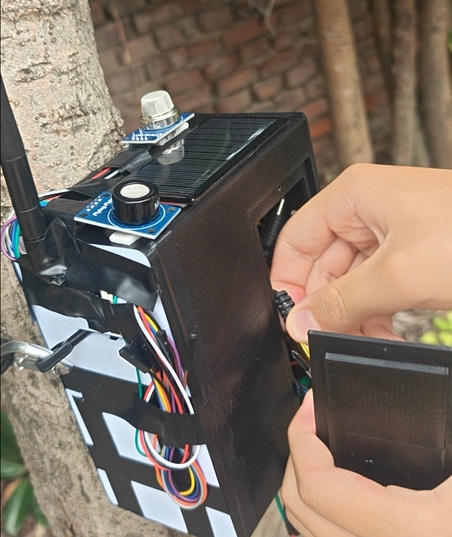
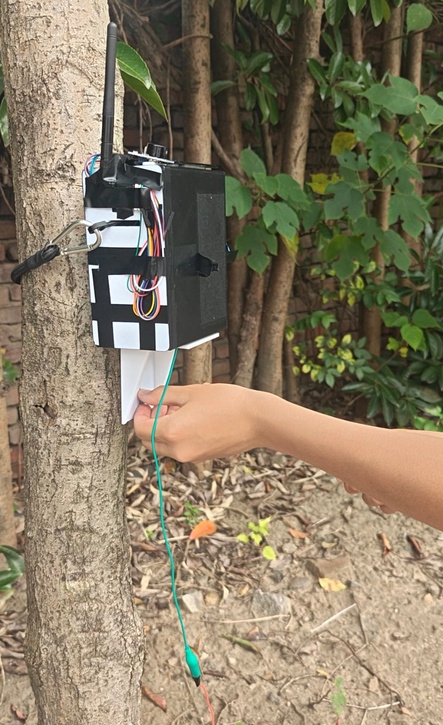
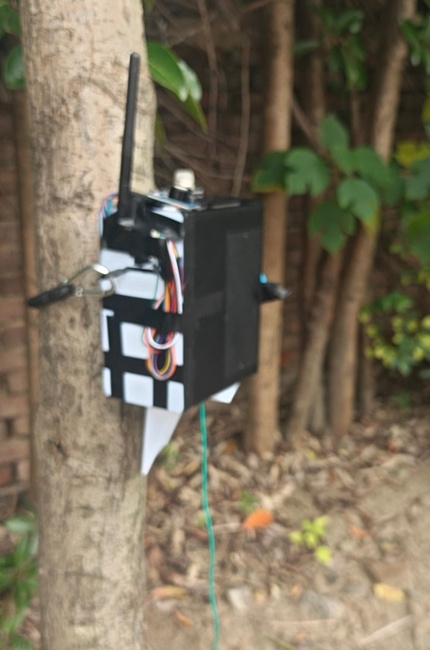
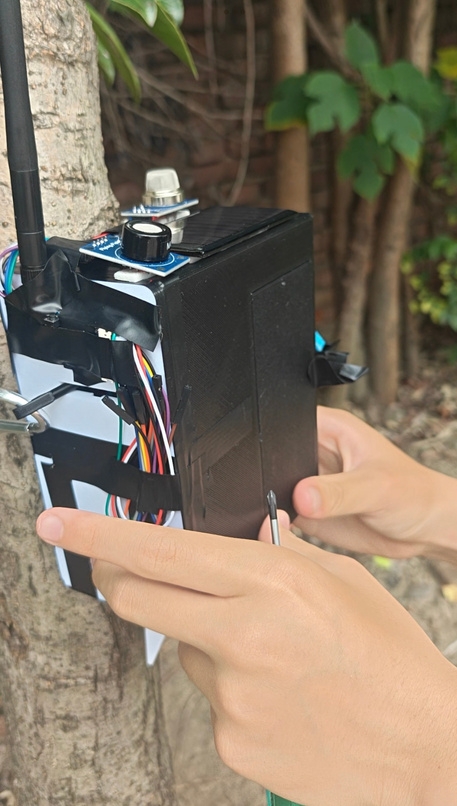
The plant species used was Pachira Macrocarpa. Using the same logistics as the energy-providing system in the monitor system:

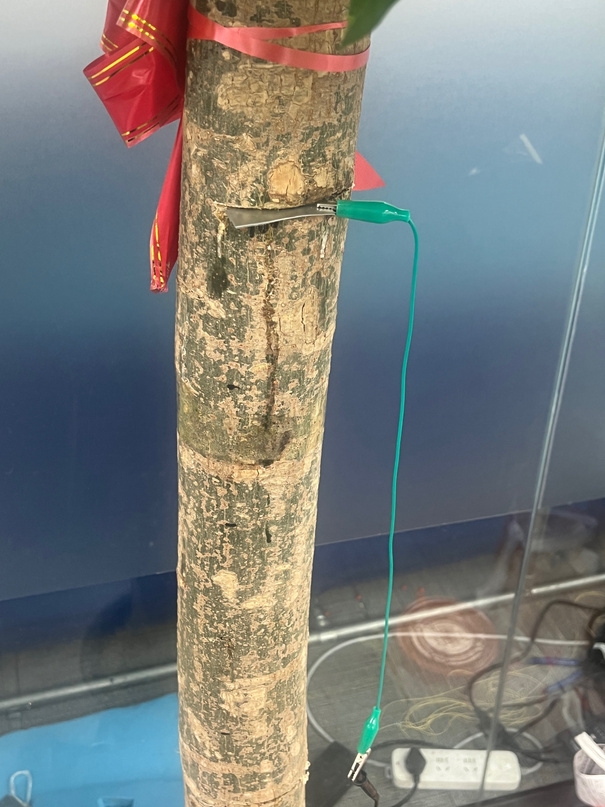
  1. A zinc sheet was inserted in an incision of depth around 1 centimeter deep approximately 1 meter above the ground
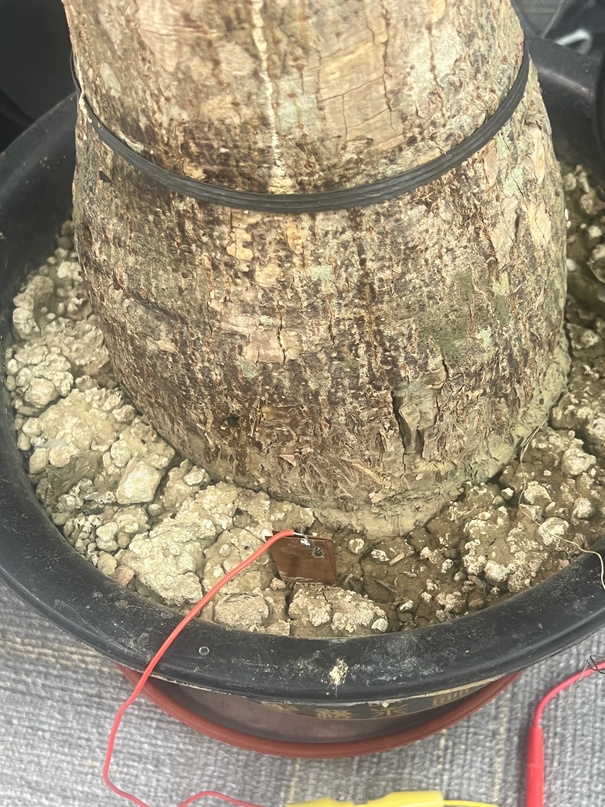
  2. A copper sheet was inserted in the dirt around 10 centimeters near the tree approximately 1 centimeter deep
  3. The zinc sheet and copper sheet were connected with an electrical cable
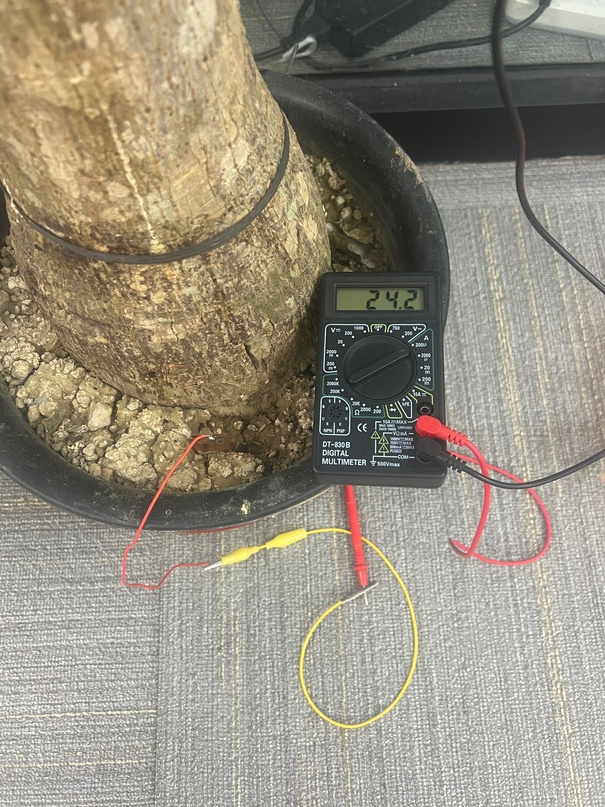
  4. An electric multimeter was used to record the voltage in millivolts and current in microamperes
  5. Measurements taken every 60 minutes for 11 hours (Experiment 1)
  6. Process repeated with measurements every 30 minutes for 11 hours to ensure experimental precision (Experiment 2)

Image: Tree used for experiment - Pachira Macrocarpa

Image: Zinc Sheet (Negative Charge) inserted into tree

Image: Copper Sheet (Positive Charge) in soil

Image: Voltage/Current Test measurement setup

Experiment Results

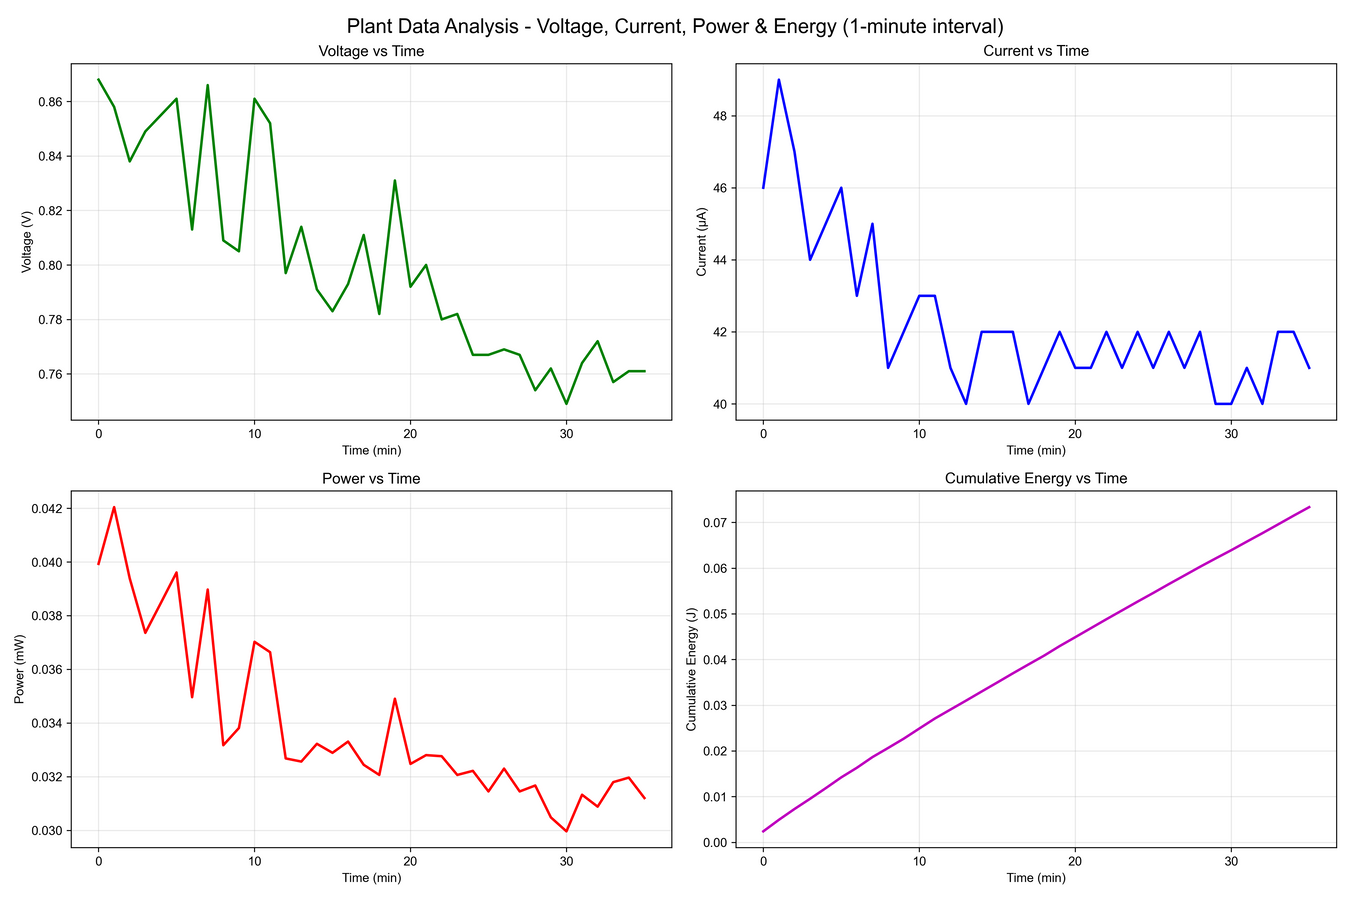
Experiment 1: Voltage Test (1 hour interval)

Graph: Voltage (mV) over Time showing readings from 10:00 to 21:00

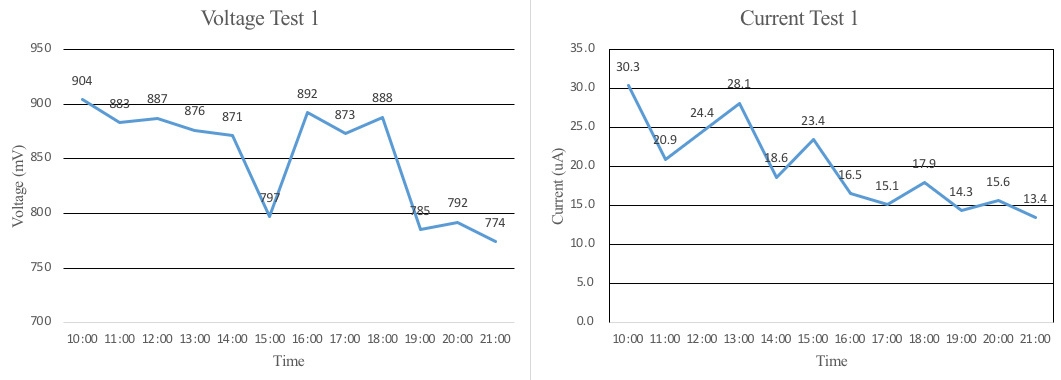
Range: ~0.84 V, relatively stable with minor fluctuations

Experiment 1: Current Test (1 hour interval)

Current Measurements Over Time (10:00-21:00): The current output from the MPD system showed readings ranging from 13.4 to 30.3 microamperes (μA) throughout the 11-hour testing period. The measurements demonstrated natural variation corresponding to the tree's metabolic activity cycles, with slightly higher currents during peak photosynthesis hours and more stable readings during evening periods.

Range: 13.4-30.3 μA, showing natural variation

Experiment 2: Voltage Test (0.5 hour interval)

Graph: Voltage (mV) over Time with more frequent sampling

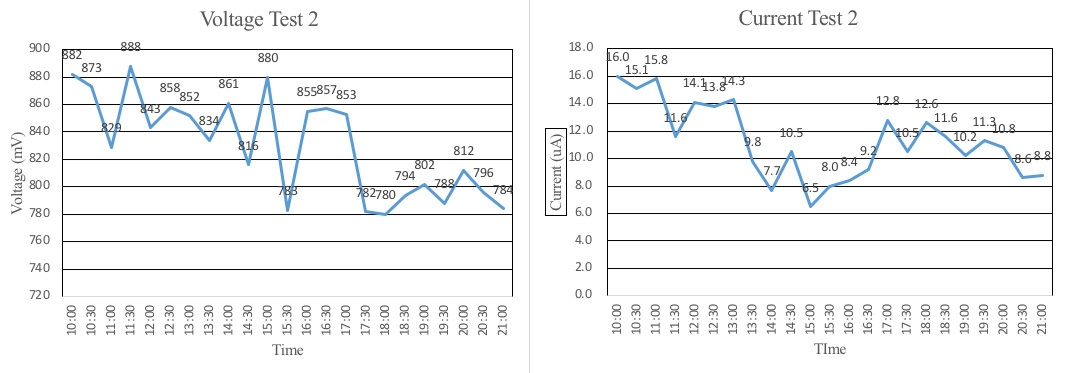
Range: ~0.84 V, confirming stability at higher sampling rate

Experiment 2: Current Test (0.5 hour interval)

Current Measurements with Increased Sampling Frequency: With measurements taken every 30 minutes instead of hourly, the current output ranged from 6.4 to 15.8 microamperes (μA). The higher sampling frequency revealed more granular variations in the tree's electrical output, capturing short-term fluctuations while confirming the overall stability observed in Experiment 1. The data remained consistent with the first experiment, validating the reliability of MPD as a continuous power source.

Range: 6.4-15.8 μA, consistent with first experiment
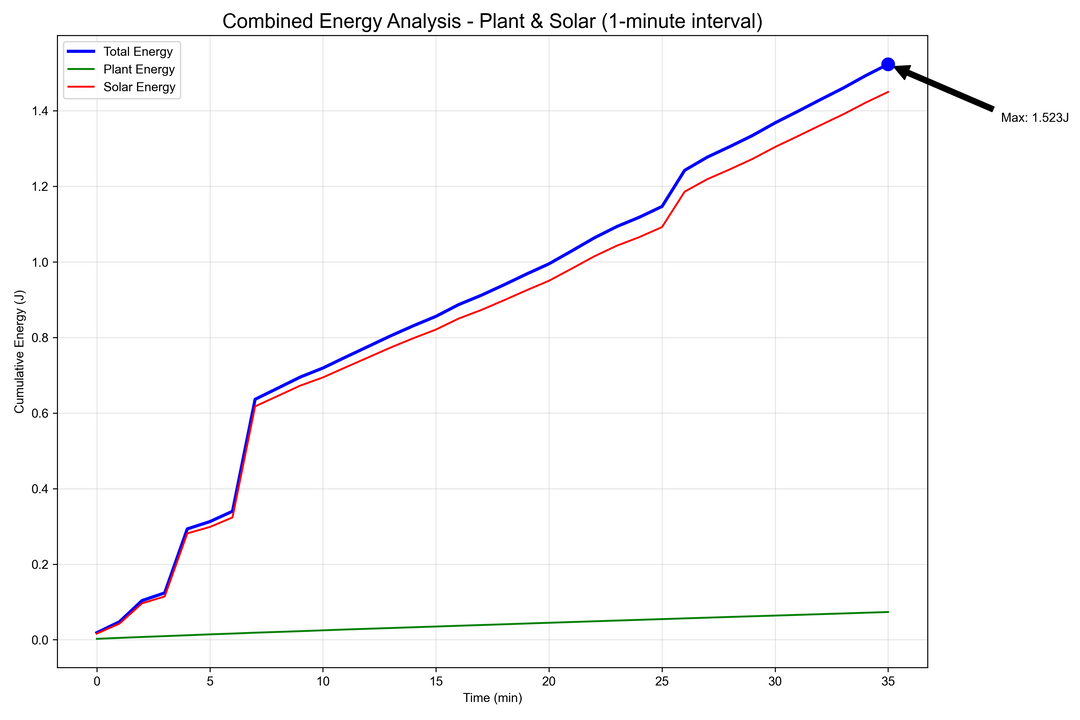
Primary Results

Results: Consistent ~0.84V output providing continuous power, demonstrating stable 24/7 operation capability

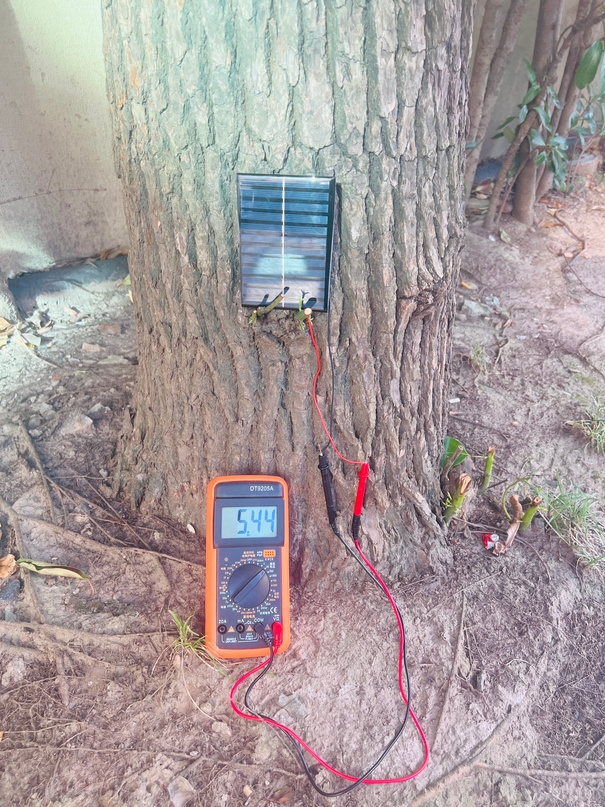
Solar Power Unit Output: 10-20 mW in full sun, ~2.87 mW under forest canopy

The system also uses an intelligent algorithm to switch between power sources based on light conditions and battery charge level (State of Charge - SOC), ensuring continuous operation and protecting the battery lifespan.

Experiment 2: System Energy Generation

Plant Energy Generation

Image: Plant setup with MPD electrodes in forest environment

Graph: Plant Data Analysis showing Voltage, Current, Power & Energy over Time (1-minute interval)

  • Energy was calculated from measured values of voltage and current for a total of 0.58 hours
  • Linear relationship between time and energy, showing energy accumulation from generation
  • Energy from plant: 0.073 J (measured over 0.58 hours)

Solar Energy Generation

Image: Solar panel mounted in shaded forest environment

Graph: Solar Data Analysis showing Voltage, Current, Power & Energy over Time (1-minute interval)

  • The graph on the right shows the energy storage from solar energy
  • The solar panel was tested with diffused lighting in the shades of a tree without direct sunlight, mimicking the condition of a forest canopy
  • Energy from solar: 1.481 J (measured over 0.60 hours)

System Energy Generation - Full Day Projections

Graph: Combined Energy Analysis - Plant & Solar (1-minute interval) showing cumulative energy over time with Max = 1.63 J

Energy Analysis Report

Plant data collection duration: 0.58 hours
Solar data collection duration: 0.60 hours
Energy from plant: 0.073 J
Energy from solar: 1.481 J
Combined energy: 1.554 J

Full Day Energy Calculations

ETotal = EMPD + ESolar

EMPD = E0.58 × 24/0.58 = 3.207 J

ESolar = E0.60 × 12/0.60 = 29.62 J

ETotal = 3.207 + 29.62 = 32.827 J

The calculated amount of total energy generated for a day assuming 12 hour sunlight is 32.827 J

The system uses 4 MPD-solar combinations, meaning a total of 32.827 × 4 = 131.31 J total

Energy Consumption Calculation

Energy Balance Formula

(PSolar + PMPD) × T/2 + PMPD × T/2 > PESP32-Rest × (T-t) + PWork × t

Working Power Calculation

PWork = PMQ-2 + PMQ-7 + PDHT11 + PLoRa + PESP32

Device Power (W)
DHT-11 0.033
MQ-2 0.3
MQ-7 0.29
ESP32 0.4
LoRa 0.04
Total PWork 1.064 W

PESP32-Rest = 1.65 × 10⁻⁴ W

Generated Power Calculation

PGenerated = PSolar + PMPD

PSolar = ESolar/TSolar = (1.481 / 0.58 / 3600) × 4 = 2.870 × 10⁻³ W

PMPD = EMPD/TMPD = (0.073 / 0.58 / 3600) × 4 = 1.398 × 10⁻⁴ W

Sensor Work Time Calculation

T = 15 mins = 900 s (assumed work period with 15 minutes in ESP-32 deep sleep)

(2.870 × 10⁻³ + 1.398 × 10-4) × 900/2 + 1.398 × 10-4 × 900/2 = 1.417 J

1.65 × 10-4 × (900-t) + 1.064 × t < 1.417 J

t < 1.192 seconds (maximum possible transmission period)

Daily Energy Balance

Based on the device's 1 second transmission time, the calculation for the power consumption is as follows:

24 × 60 × 60 / (900 + 1) × (1.064 + 1.65 × 10⁻⁴) = 102.05 J

Total energy generated: 131.31 J

Total energy consumed: 102.05 J

Energy surplus: 29.26 J (22% buffer)

131.31 > 102.05, meaning that our energy providing system can completely sustainably power our sensor system with an excess amount of 29.26 J, a 22% buffer. The excess amount of energy is stored and enhances system stability in different weather conditions.

Experiment 3: Testing Sensor Communication

Image: Device being held and tested outdoors

Image: Device mounted on tree for testing

Image: Device in operation showing sensors

Image: Multiple angles of device deployment

Test Objective

To test the sensor feedback and communication feasibility of the system, I experimented the device's feedback to the serial port in a computer approximately 100 meters away using the LoRa communication module.

Serial Port Data Output

rst:0x1 (POWERON_RESET), boot:0x13 (SPI_FAST_FLASH_BOOT)

configsip: 0, SPIWP:0xee

load:0x3fff0030,len:1184

load:0x40078000,len:13220

ho 0 tail 12 room 4

load:0x40080400,len:3028

entry 0x400805e4

Received: 27C, 49%, MQ2:1897.22 MQ7:0.00

Received: 27C, 49%, MQ2:1578.31 MQ7:0.00

Received: 27C, 49%, MQ2:1862.88 MQ7:0.00

Received: 27C, 49%, MQ2:1397.80 MQ7:0.00

Received: 27C, 49%, MQ2:1224.12 MQ7:0.00

Received: 27C, 49%, MQ2:2443.64 MQ7:0.00

Data Visualization

Graph: Temperature over Time - showing ~27°C steady

Graph: Smoke (MQ-2) over Time - showing variation between 1200-2500 PPM

Graph: Humidity over Time - showing ~49% steady

Graph: Carbon Monoxide (MQ-7) over Time - showing near 0 PPM

The image above shows the received data of the temperature and humidity from the DHT-11 sensor, the parts per million of smoke from the MQ-2 sensor, and the parts per million of carbon monoxide from the MQ-7 sensor, verifying the signal transmission of the forest fire detector.

Progress in Development

The development progress has followed an iterative design cycle, advancing from a proof-of-concept breadboard to a functional field-ready prototype.

Phase 1: Component Integration

Successfully created a unified device architecture housing the sensor array, hybrid power system, and communication module within a rugged, 3D-printed enclosure.

Phase 2: Power Management Firmware

Developed proprietary energy management algorithm to dynamically allocate power from MPD and solar sources while managing backup battery storage.

Phase 3: Field Verification

Conducted preliminary field-testing on campus trees, collecting real-world data on power stability and verifying LoRa range.

Next Steps

Environmental stress-testing, electrode optimization for long-term biotic compatibility, and sensor fusion refinement.